Wednesday 14 March 2012

The Age of Premium Bonds

People often ask why a lot of winners appear to be from recently bought bonds. I sometimes suspect that they begrudge people who have just bought bonds their win! However these people have the same chance in any monthly draw as everyone else once their bond is eligible. Obviously over time the longer you have your bonds in the more chance you have of winning.

The table below shows the proportion of winners by decade of when they bought their winning bond of all the big winners from January 2004 through to March 2012 for prizes of £5,000 and above.


Wins by Decade
Total
1950 0.07%
1960 0.28%
1970 0.65%
1980 1.48%
1990 18.10%
2000 77.10%
2010 2.31%
Grand Total 100.00%


As you can see the vast majority of bonds were bought in the 2000's. 

Data coverage is not complete and all mistakes in analysis are mine!

Saturday 10 March 2012

How long before I win (big)?

Based on data from January 2004 through to March 2012 for all big winners of £5,000 and above the following table summarises:

  • The total number of winning bonds (£5,000 and above)
  • The total prize value for that year
  • The average number of months that someone had held the winning bond at the winning date and
  • The average value of the the bond holding for winners at the win date (maximum is £30,000)


Year
Number of Winning Bonds
Total Prize Value
Average Months Held Bond at Win Date
Average of Value of Holding at Win Date
2004
1,427
£31,155,000
50.95
£17,828
2005
2,332
£48,290,000
54.26
£18,707
2006
3,295
£71,175,000
54.72
£19,494
2007
8,846
£146,200,000
54.82
£20,046
2008
3,832
£75,475,000
60.44
£20,507
2009
992
£28,250,000
60.84
£20,939
2010
1,718
£34,005,000
67.61
£20,678
2011
1,962
£38,265,000
69.75
£21,349
2012
501
£9,740,000
74.20
£21,861
Grand Total
24,905
£482,555,000
58.09
£20,010


Comments 
  • Big winners in 2004 had held their bonds for a little  over  four years (50.95 months) 
  • Big winners in 2011 had held their winning bonds on average for almost six years (69.75 months - ignoring 2012 for the moment as it is not complete)  
  • This suggests that people are holding their bonds for longer as the big winners should be a random sample from the population
  • Also it appears that people are increasing their average holding from £17,828 in 2004 to £21,349 in 2011
  • The total prize value for a year is a function of the total number of bonds eligible to win prizes and the effective interest rate 
  • 2007 was the 50th anniversary year which is why there are so many prizes that year 
All of the data for this analysis was collected from the National Savings and Investment High Value Winners page. Any errors in the calculations will be my fault!

The data from 2004 through to 2011 is not complete I have a few months missing. I will publish the coverage table soon. 

Data Sources

There are two main data sources available for analysis of Premium Bonds in the United Kingdom. The National Savings and Investment web site has published these in a variety of different formats over the years.

The current months high value winners can always be found on the high value winners page.

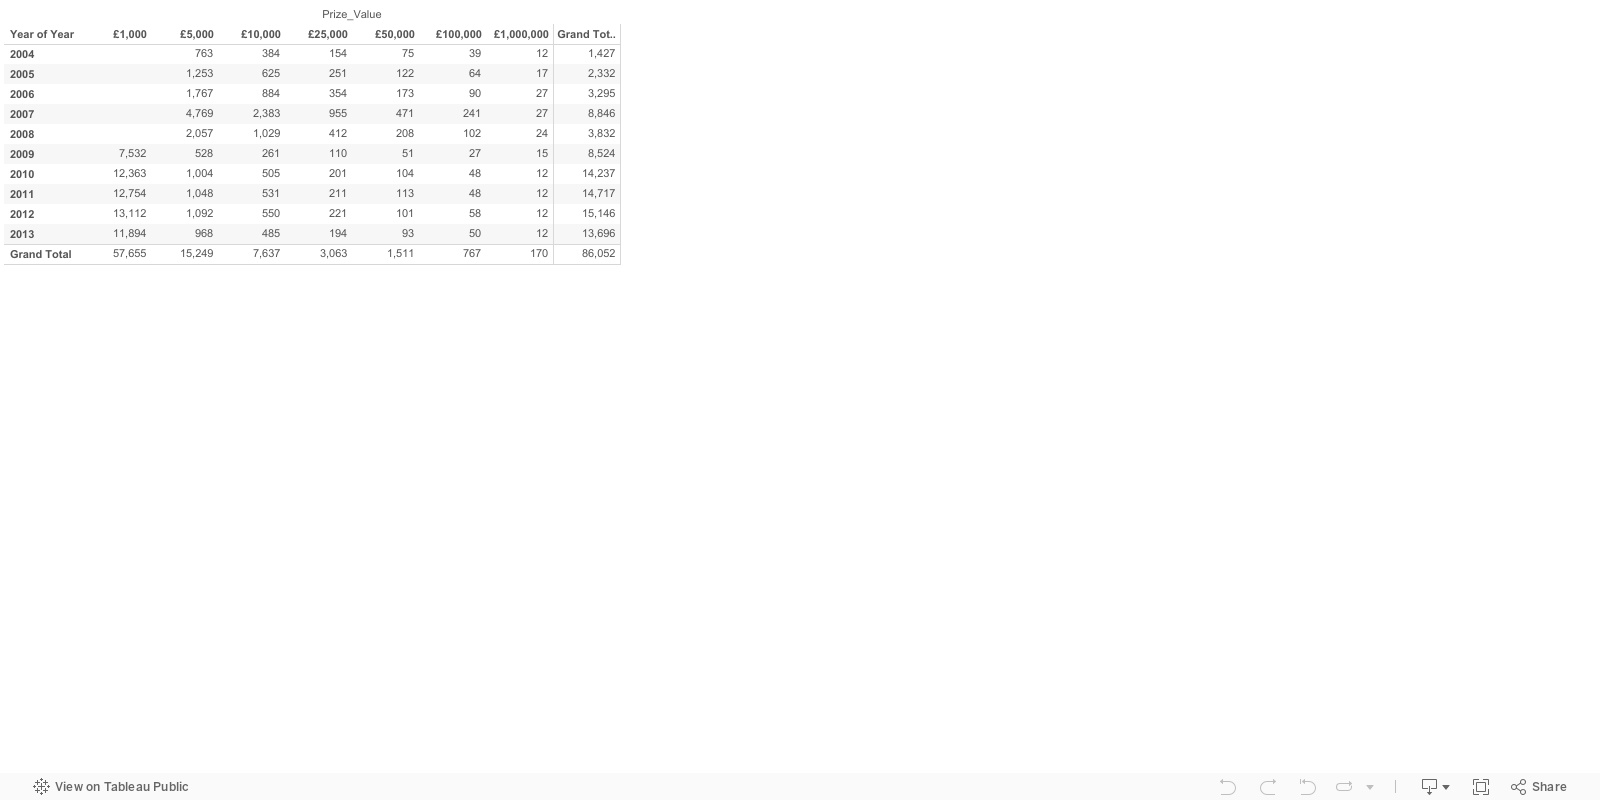
This details the following information for each win over £1,000 (this hasn't been consistent over the years - see the section on data history):

  • Winning Bond Number 
  • Holding Value for the winner (maximum of £30,000 under current rules) 
  • Area - the area in which the winner lives - more on this later 
  • Bond value - the value of the winning bond. However I think that the winning bond number above equates to a single £1 bond within this bond value. The bond value is the size of the bond when it was bought. 
  • The purchase date of the bond in the MMM-YY format.
The second source of data is a complete list of all of the winning bond numbers and the value of the win. Previously this has been supplied as a PDF file but is currently supplied as a ZIP encoded text file. This contains approximately 1 million winning bond numbers per month. The last six months are shown on the   high value winners page.

As well as the official National Savings and Investment web site the This is Money web site also has a list of big prize winners of £5,000 and above and also a list of all of the £1,000 prize winners on a separate tab. 

Data Coverage

The data coverage is not complete. The table below shows the number of winners by year and by prize value for all of the big winners of £1,000 and above. You can see that I am missing some data on the £1,000 winners for the years prior to 2009. I have previously requested some data from NS&I using FOI requests but I have not yet attempted to get this data.


Total Winnings by Year

The graph below shows the distribution of total winnings by year since 2004 for all large wins of £5,000 and above. I don't have the £1,000 winners prior to February 2009. 


The total prize value by year from 2004 to date for those big wins of £5,000 and above. Note that 2007 was a special year for National Savings and Investment as it was their 50th Anniversary year.